
OmniSync
B2B dashboard that won 4 contracts
Turn hours of manual reporting into a dashboard that updates itself and prove the concept can scale
OmniSync had built data infrastructure for innovation ecosystems, but hadn't yet proven there was a market for custom portfolio dashboards as a standalone product.
Gener8tor became the first client to validate the concept — but the stakes were high. OmniSync needed to prove the dashboard could be designed, delivered, and scaled across different accelerator types, while meeting a real client's complex data and stakeholder needs.
Accelerator program managers typically spend 10–15 hours per quarter on manual investor reporting alone — and that's before accounting for founder update chasing, intro facilitation, and event coordination. For Gener8tor, managing 150+ companies across 6 programs with no centralized system, the operational cost was significant
Design for the data we couldn't predict: a reusable interaction and visualization system
My research goal was to identify the interactions that would translate across domains and scale with the system. Because every client would bring different data and different metrics they cared about, the dashboard couldn't be designed around any one dataset. It had to work as a shell that any client's data could be plugged into.
That meant the experience work came down to two things: nailing the key interactions, and defining a baseline range of data visualizations my engineering team could build into reusable components. That way, neither the visuals nor the interactions would need to be rethought for each new client.
I also designed the dashboard as a dual view: a signed-in view where the client manages their data, and a public view they curate for anyone with the link. This solved the reporting problem directly. Instead of manually drafting investor reports and doing outreach one by one, the client just keeps their public view up to date, and investors always have a current window into the portfolio.
Universal Filtering System
One filtering pattern, any dataset. Because clients each track different metrics, the filters were designed as a universal interaction rather than a fixed set of options. Whatever data a client plugs in, the same system adapts to it, so nothing gets redesigned for the next accelerator.
Unified and Searchable Data View
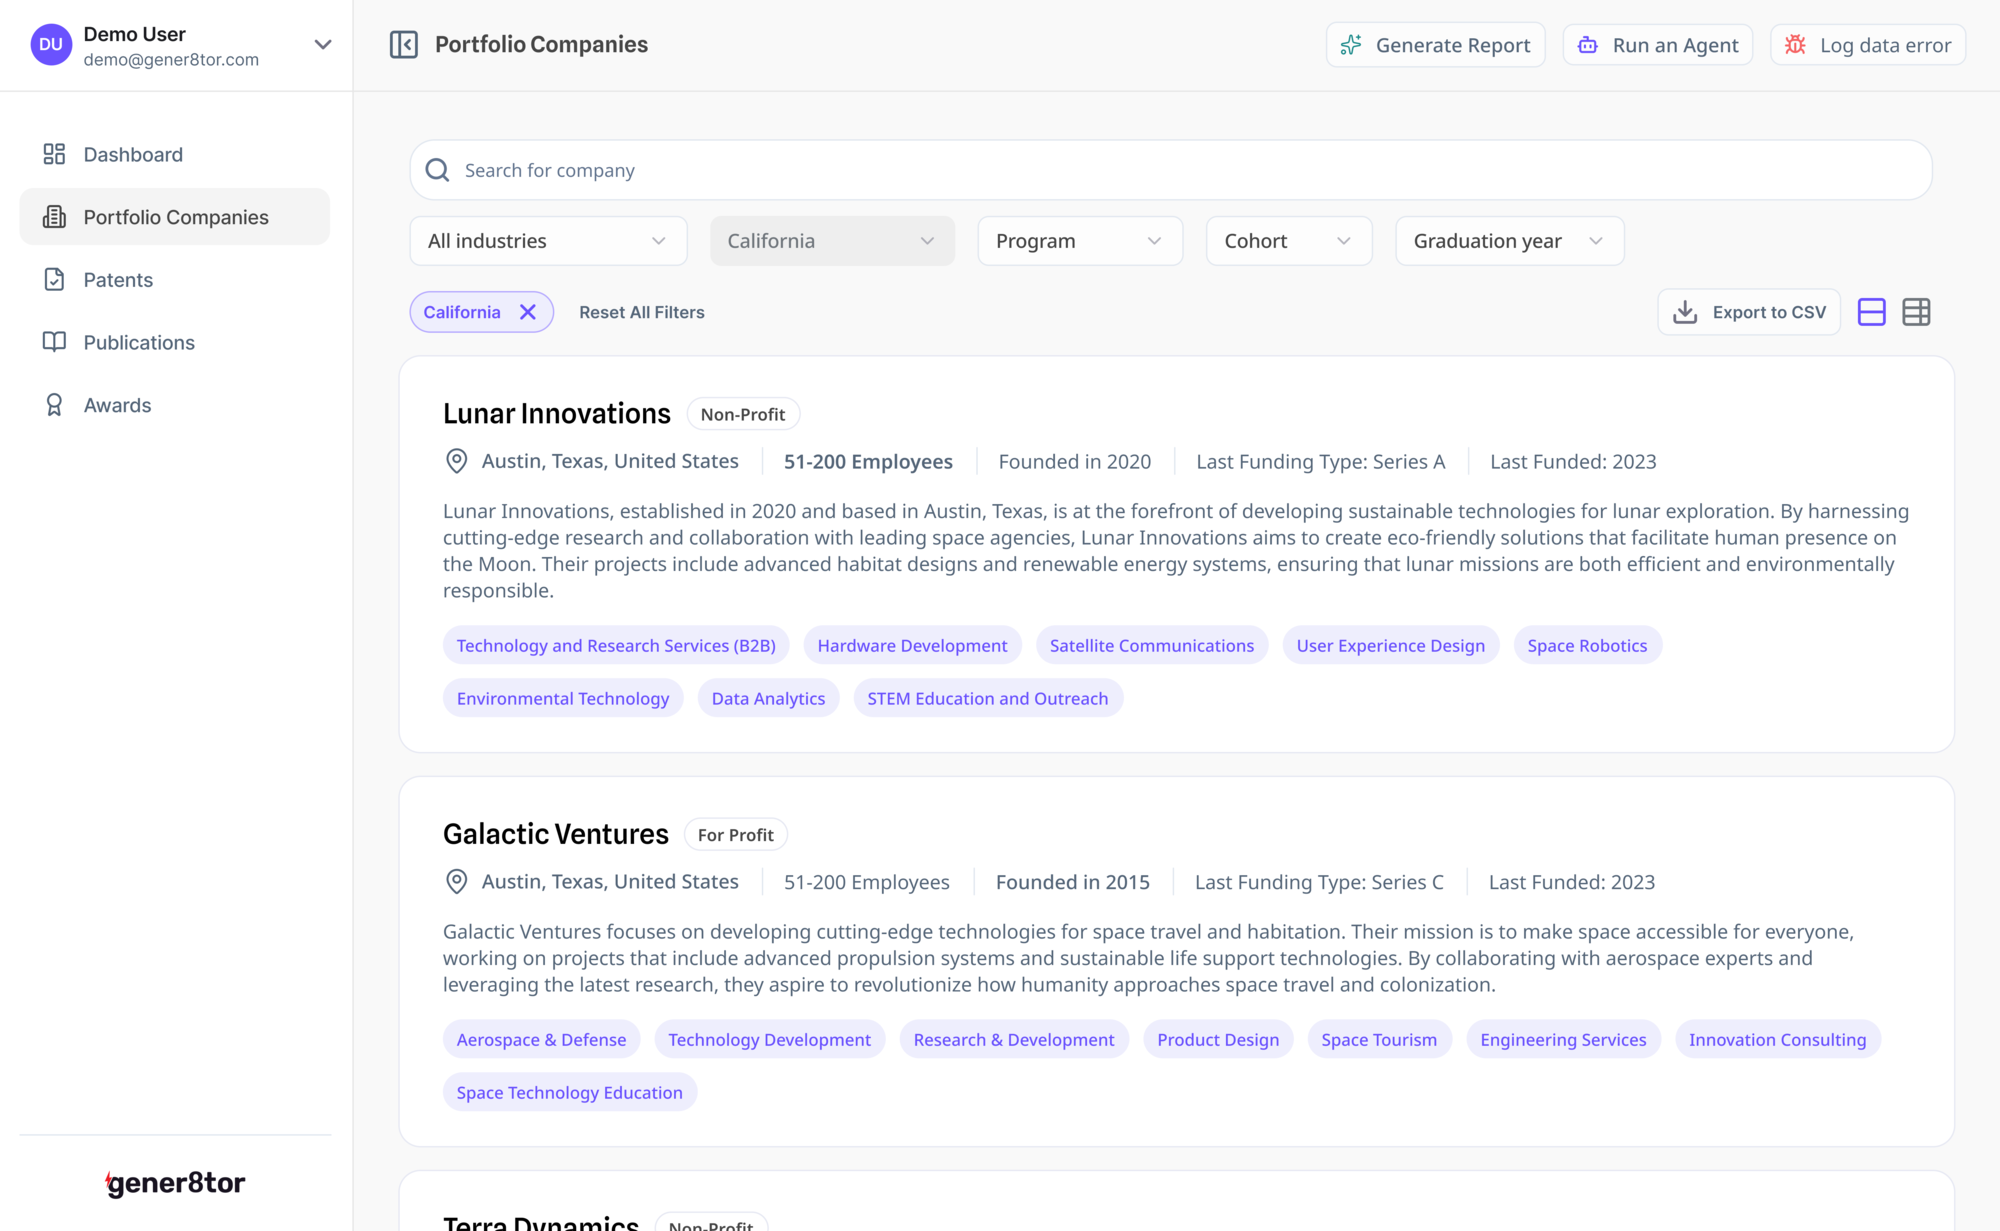
Every company, one searchable home. The client's portfolio data lived across Airtable bases and spreadsheets, so answering a simple question meant hunting. The unified view brings all 150+ companies into one place with multiple ways to slice it, replacing Airtable entirely.
Dual View for Easy Sharing
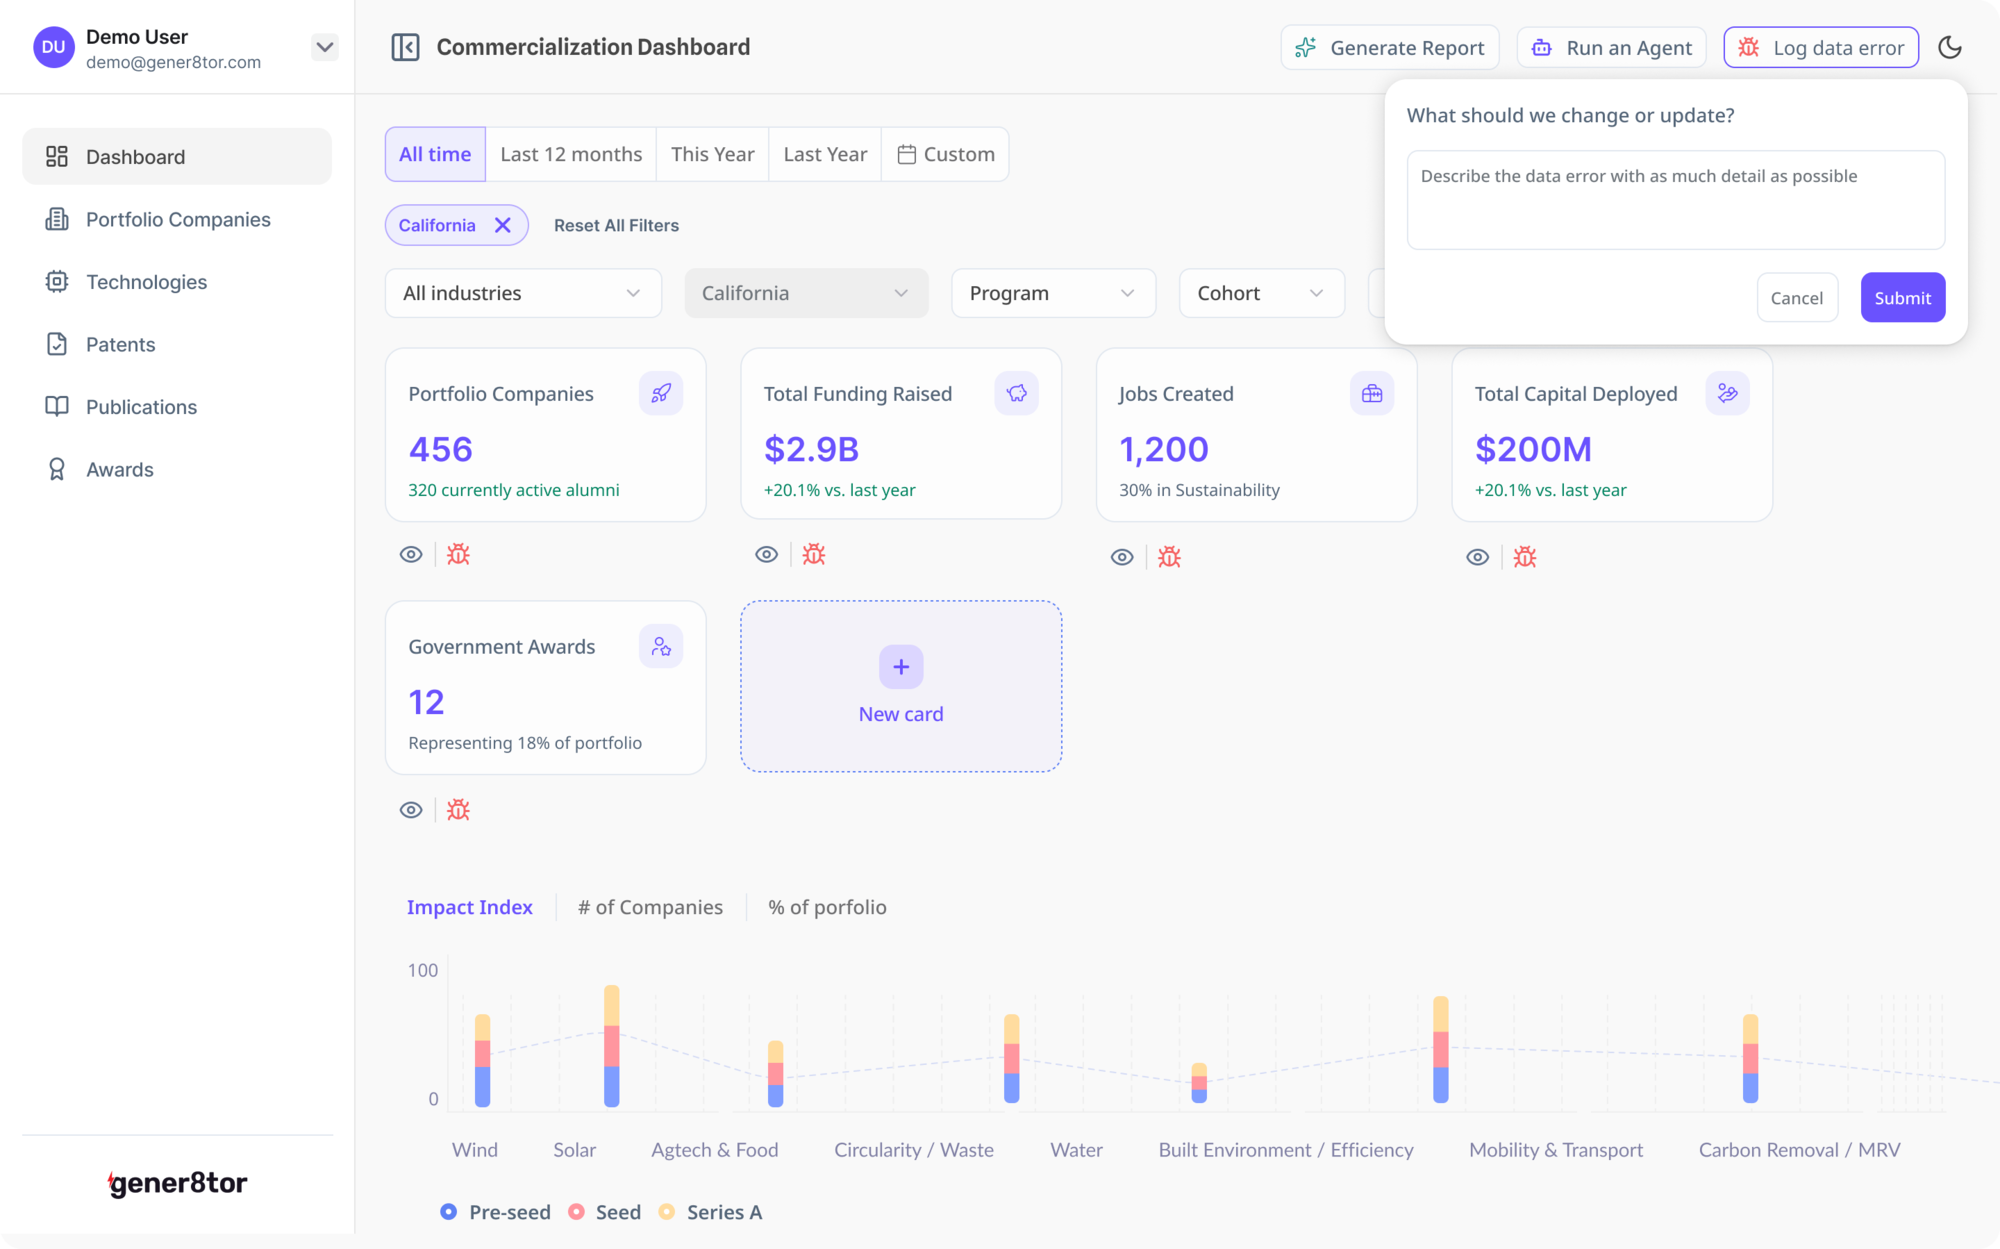
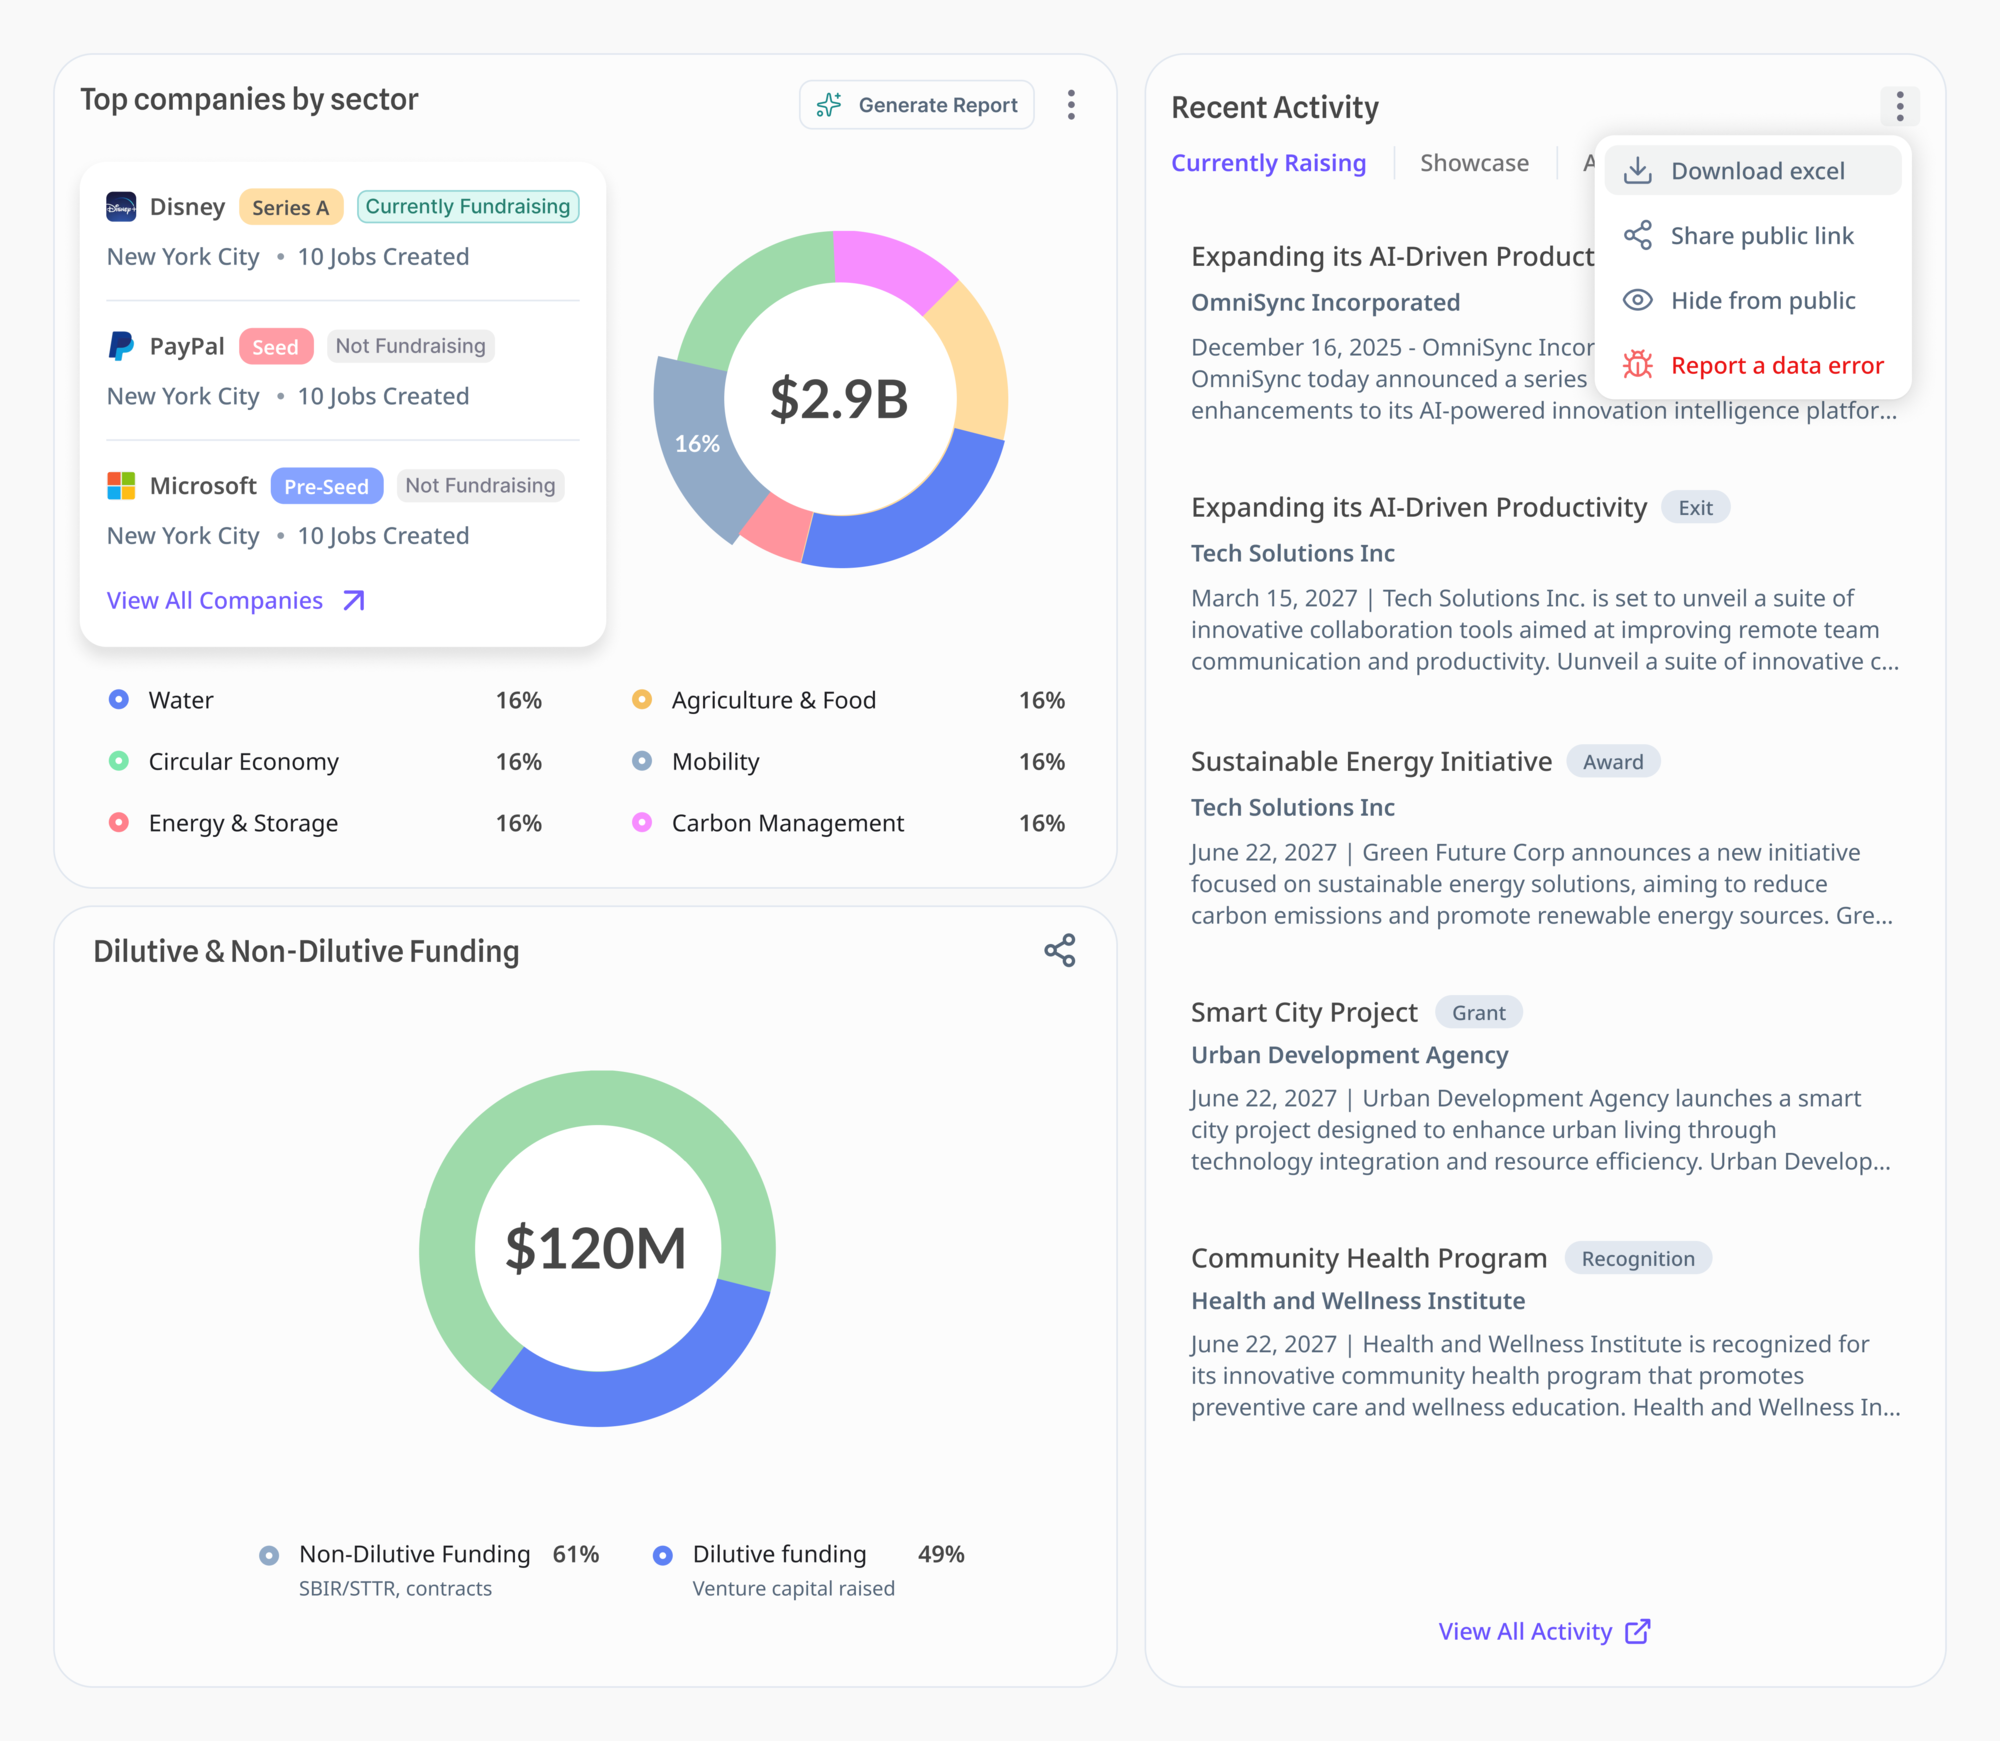
One system, two audiences. The signed-in view is where the team manages their data. The public view is a curated, always-current window for investors, shared with a single link. No more drafting reports or chasing follow-ups.
When you can't design for every use case, design the foundation.
Designing for use cases we couldn't predict taught me to invest early in foundational interactions rather than custom visualizations, and rapid iteration with the Gener8tor team proved it out: two revisions to a working design, and a component library the engineering team still builds from. If I did it again, I'd close the feedback loop with investors sooner and hold the public view to the same standard as the rest.